Data analysis & reporting
Fast and powerful findings and facts from your monitoring environment

Fast and powerful findings and facts from your monitoring environment
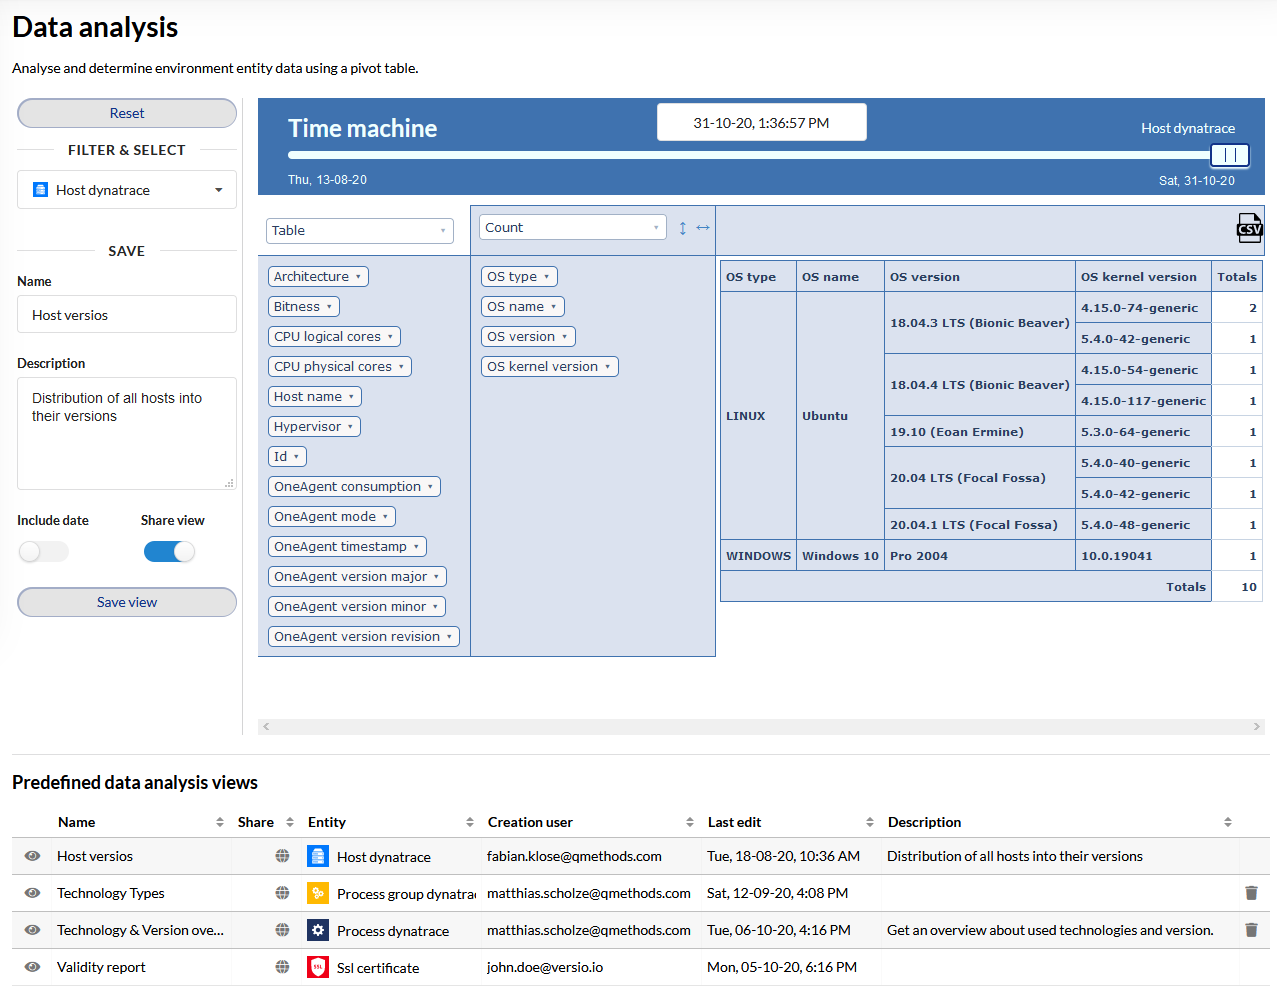
Based on the technique of a pivot table you can group or define individual monitoring attributes analysing your data thoroughly and individually. With this solution you gain transparency over the count of any item or calculated values in your inventory.
Analysis & Inventory gives you a clear insight into your environment to strengthen your basis for decision-making and your inventory management.
Visualization of CMDB topology creates significant decision insights

Visualization of CMDB topology creates significant decision insights
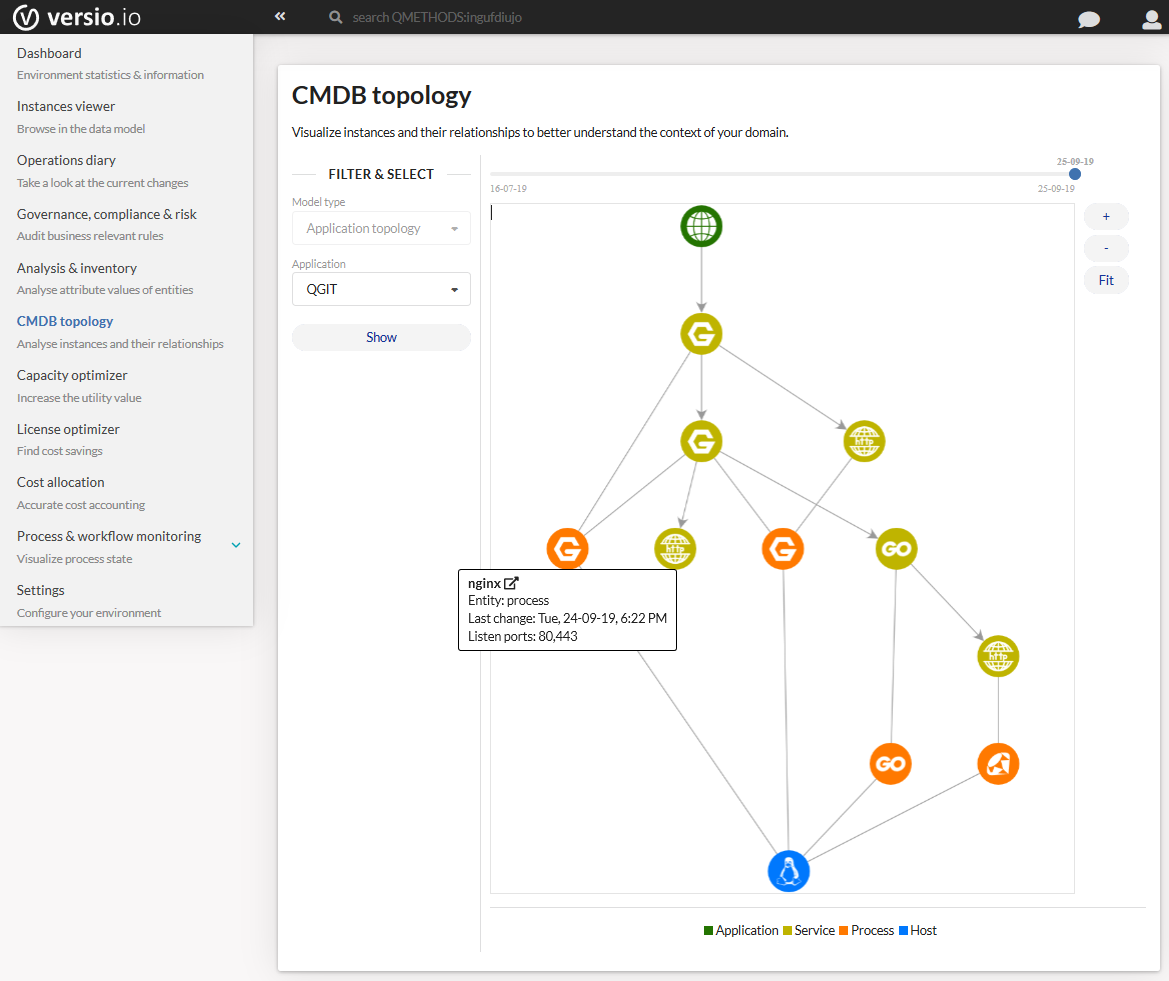
Due to the automated visualization of topologies and relational graphs you can discover hidden insights.
The Versio.io topology provides you with transparency about the development of the system architecture for the current state of your software application as well as its history.
Furthermore, specific relations of configuration item types (horizontal topology) or freely definable CI type relation areas can be mapped.
Easy recognition of analysis in 1000's of business & IT metrics

Easy recognition of analysis in 1000's of business & IT metrics
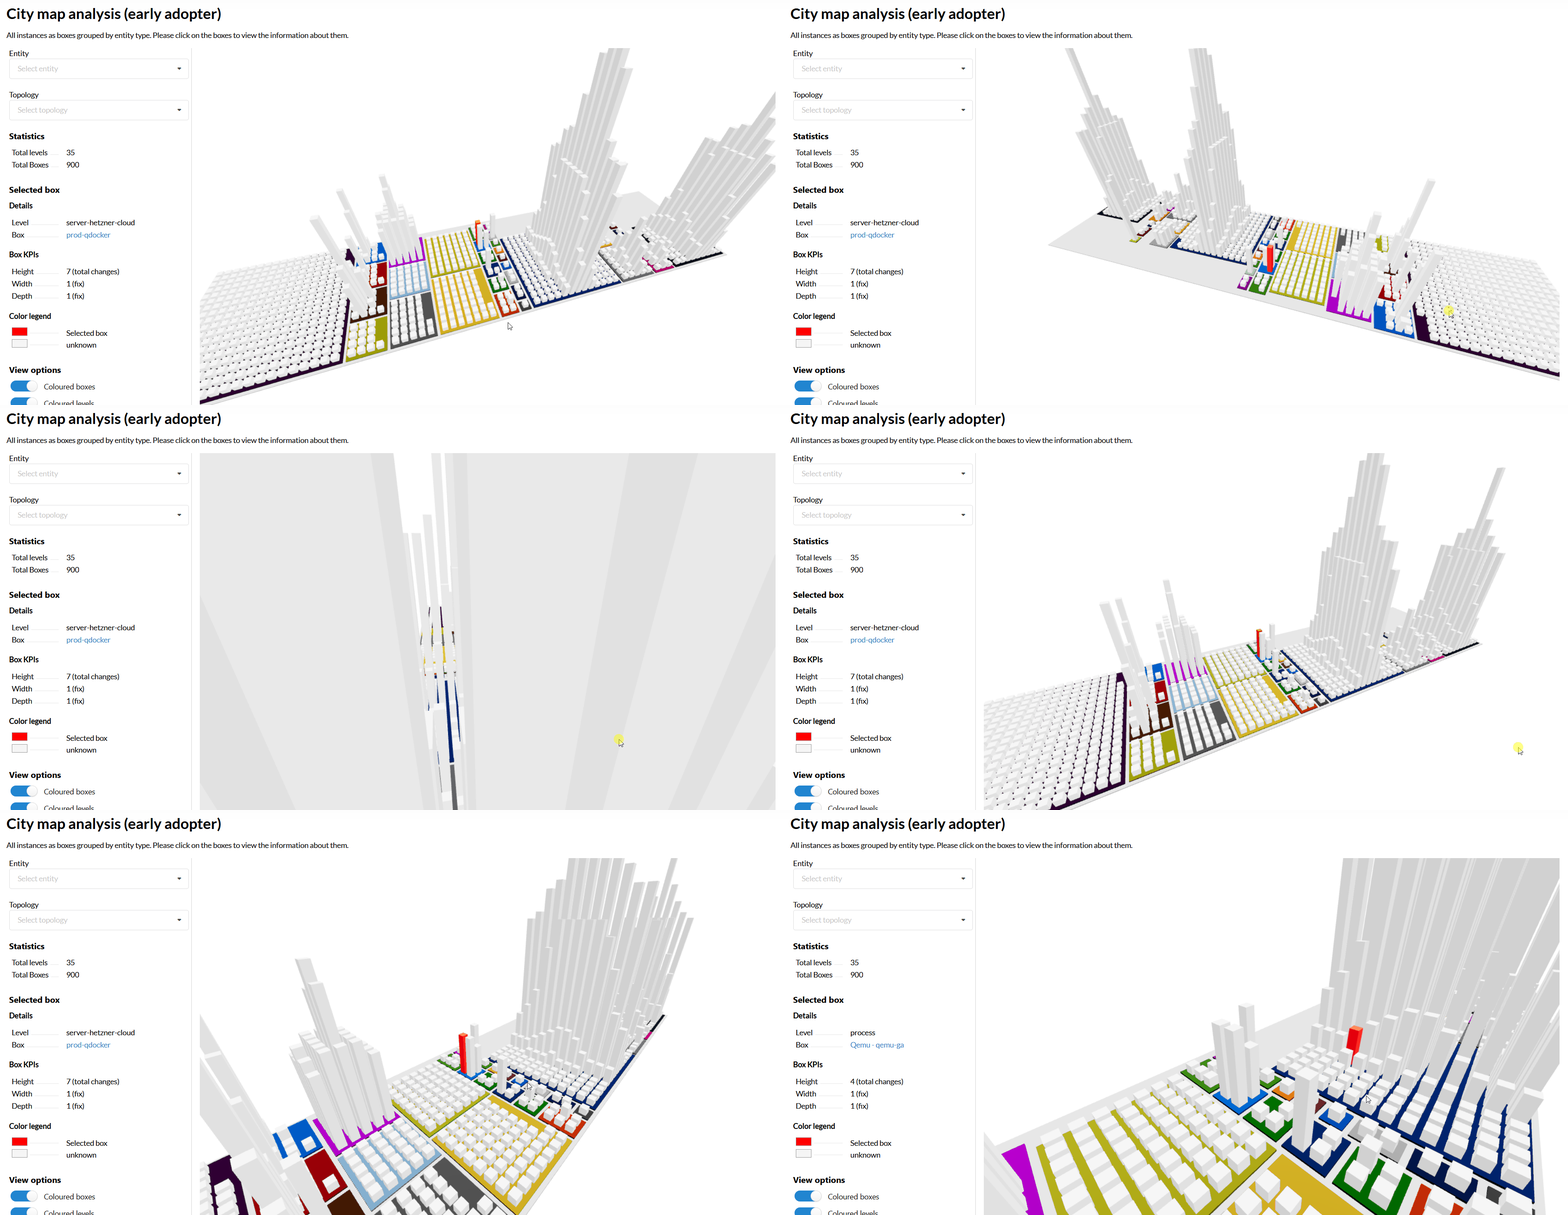
Virtualization in the form of a city map is particularly helpful when it is necessary to represent several pieces of information about a very large number of objects.
It makes it very easy for the viewer to visually understand the mass of represented objects with their individual characteristics and to recognise special aspects or anomalies in them.
Related solutions
Keywords
