Visualize CMDB data with city maps
Easy recognition of analysis in 1000's of business & IT metrics
In a nutshell Request demo Free trialThe idea behind city map visualization
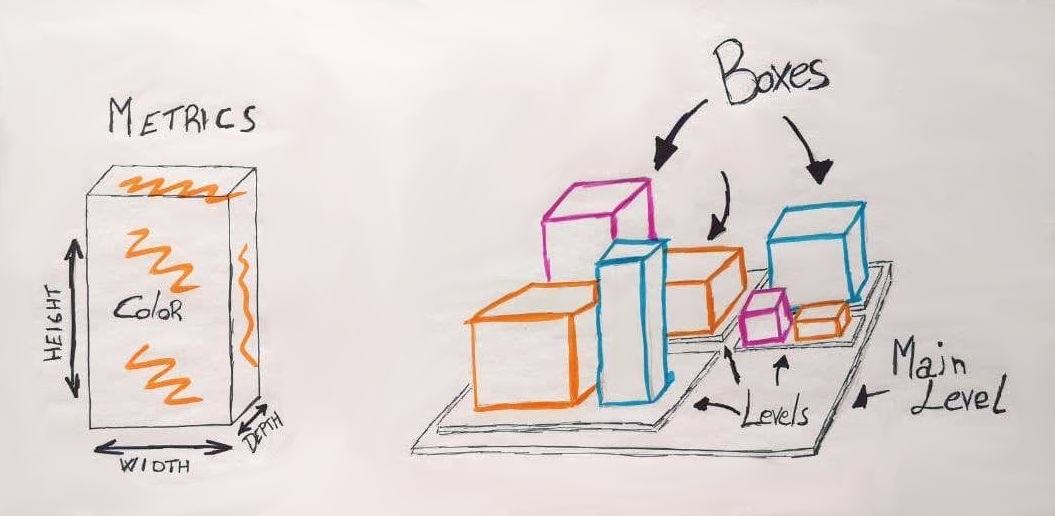
For this purpose, each object is represented on the city map in the form of a house (box). For each house, the four characteristics of the box-like representation can be defined in the form of height, width, depth and colour.
The houses can be grouped on the city map depending on a characteristic comparable to a district (level).
- Height - Amount of RAM in GByte
- Width - number of CPUs
- Depth - number of network interfaces
- Colour - | grey = internal data centre | blue = Microsoft Azure Cloud | orange = Amazon Web Service |
- Level - Associated cost centre
How to use city map in Versio.io

How to use city map in Versio.io
City map visualisation is an exciting option for analysing and visualising Versio.io configuration and change data due to the high number of data objects managed.
In Versio.io, we have realised the number of changes per managed data object using the City Map in a first application scenario (Early Adaptor). This allows users to analyse the change of instances per entity (see following figure on the right) or all existing instances (see left main menu in the figure) from the Instance History Viewer.

On the left side of the city map you will find setting options and the display of detailed information. Using the filters, you can select the entities to be analysed and then filter them based on defined topologies. The statistics show you the number of boxes (instances of all entities) and levels (entities).
If you select a box with the mouse, the user is shown the entity, the display name of the instance including a link to the details in the Instance Viewer and the four key figures of the box. In the lower area, the user is still offered options for customising the visualisation.
Prospective city development in Versio.io
City map is an effective visualisation and analysing tool. Our first implementation is ready to get familiar with the City Map. In the future, we in the Versio.io Research & Development team plan that each Versio.io component will provide corresponding queries for the City Map. Of course, we are very curious about the feedback and requirements of our customers.
Autor | July 2021


Keywords